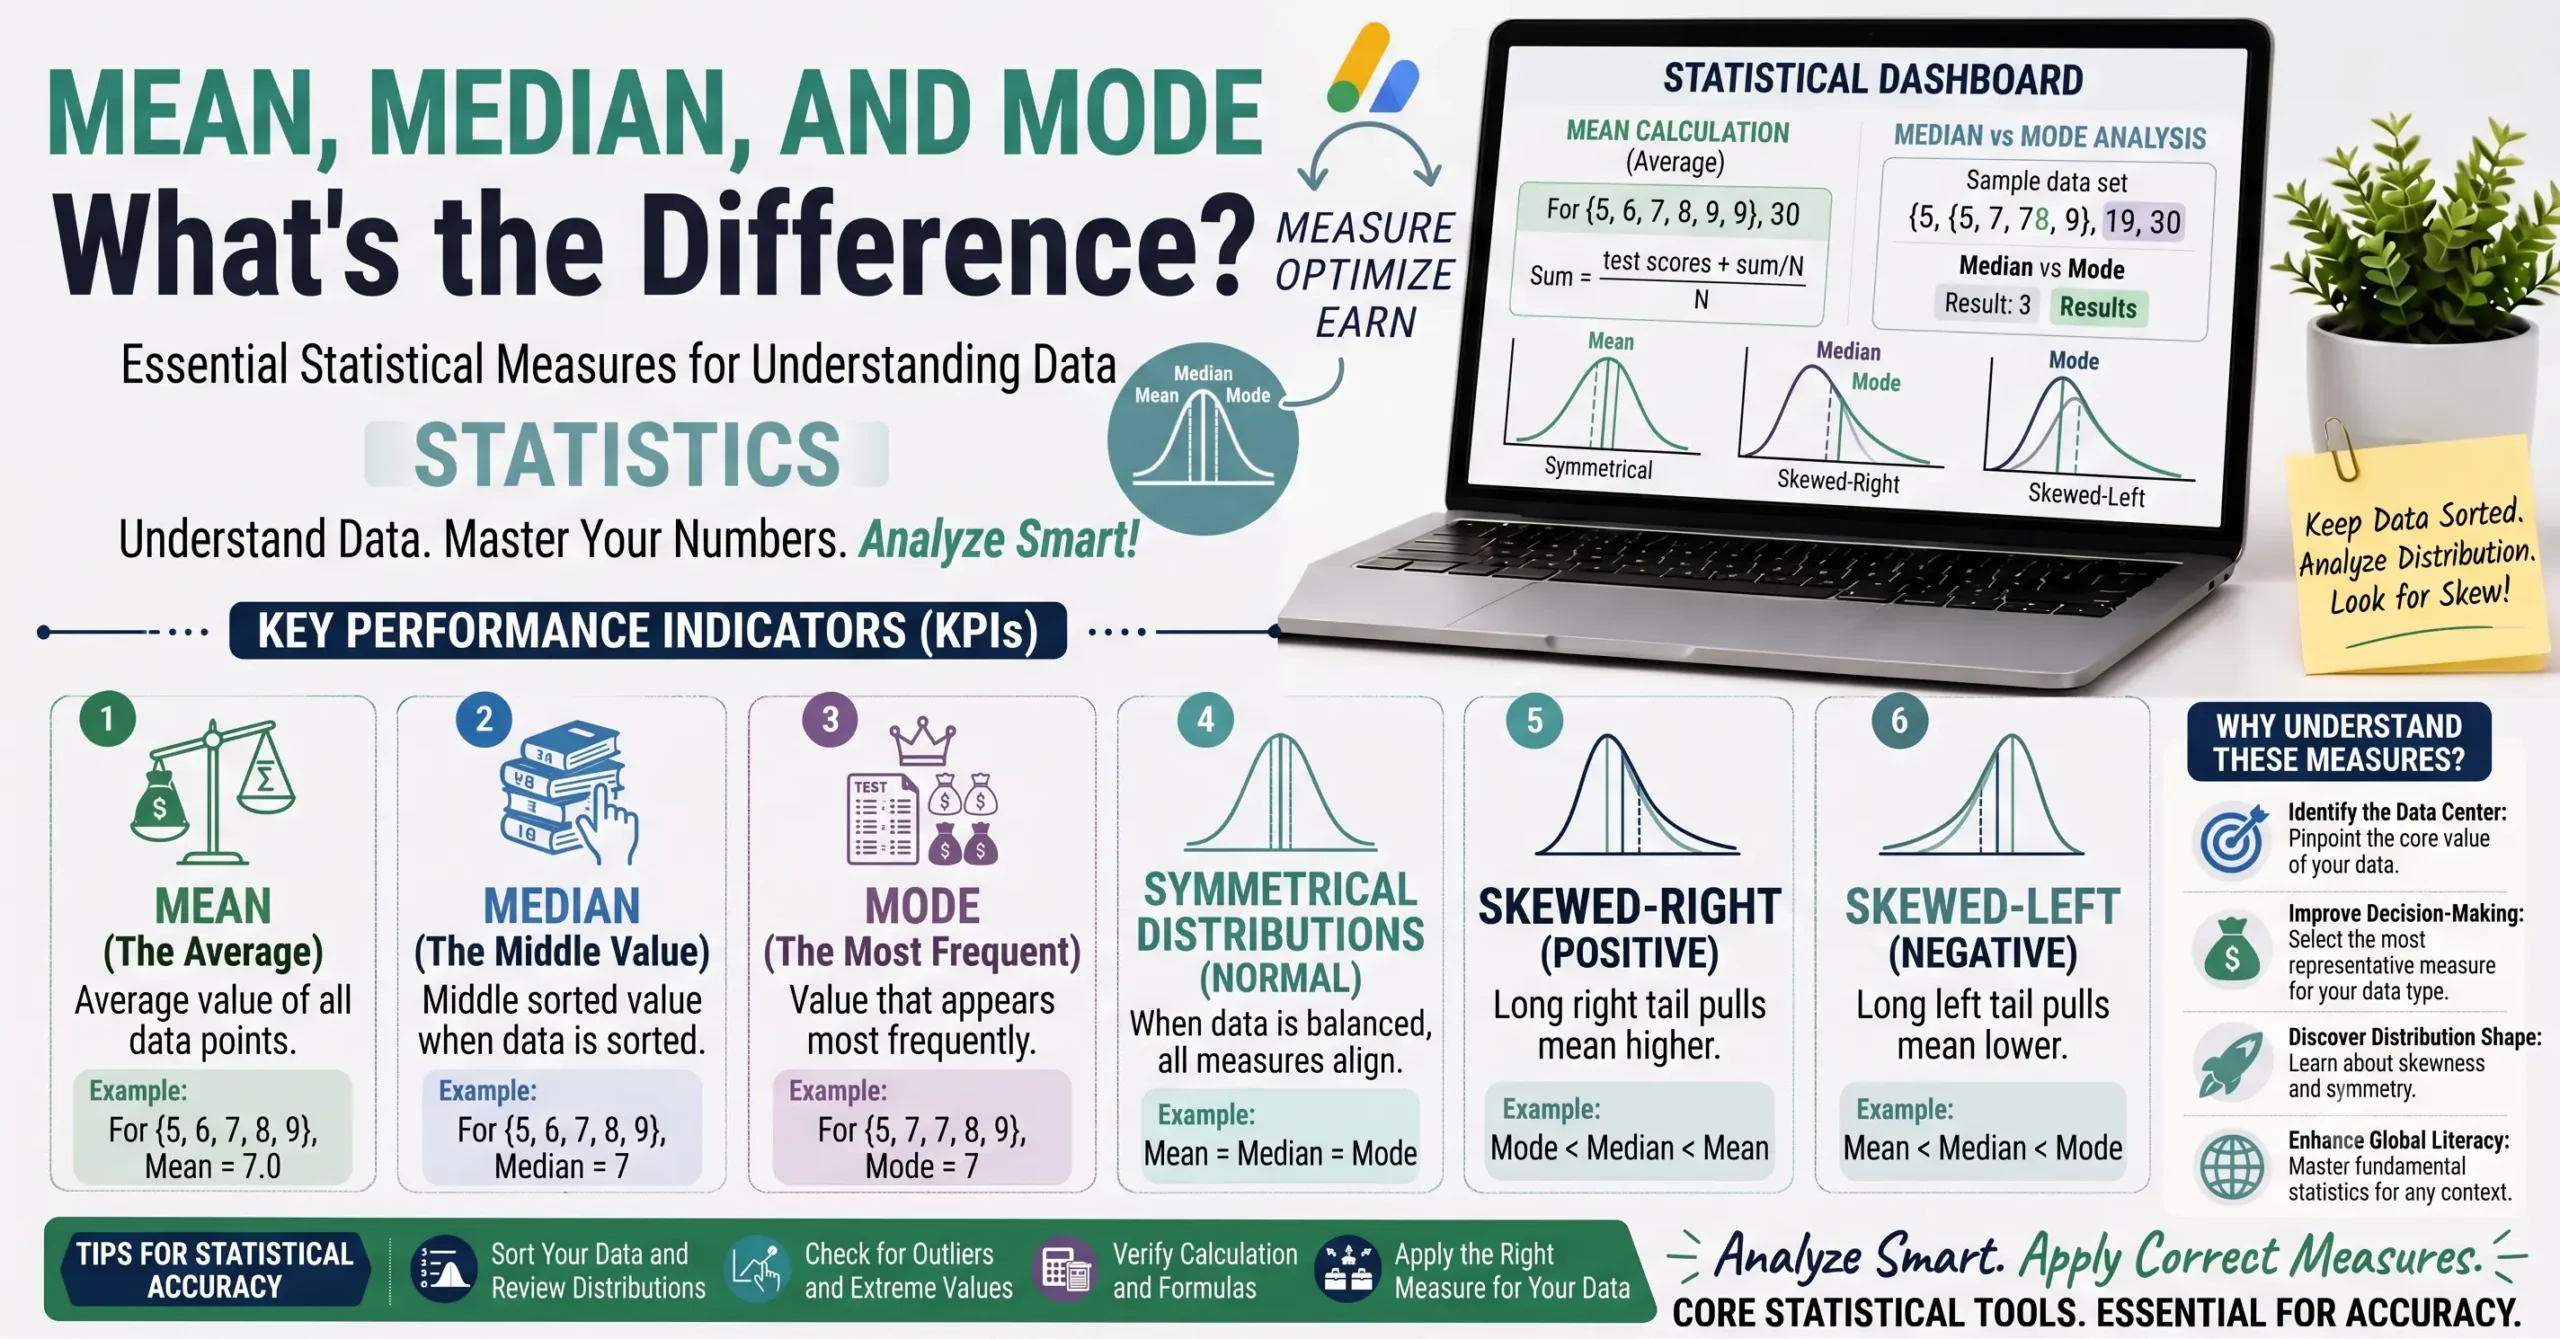
Mean, Median, and Mode What’s the Difference?
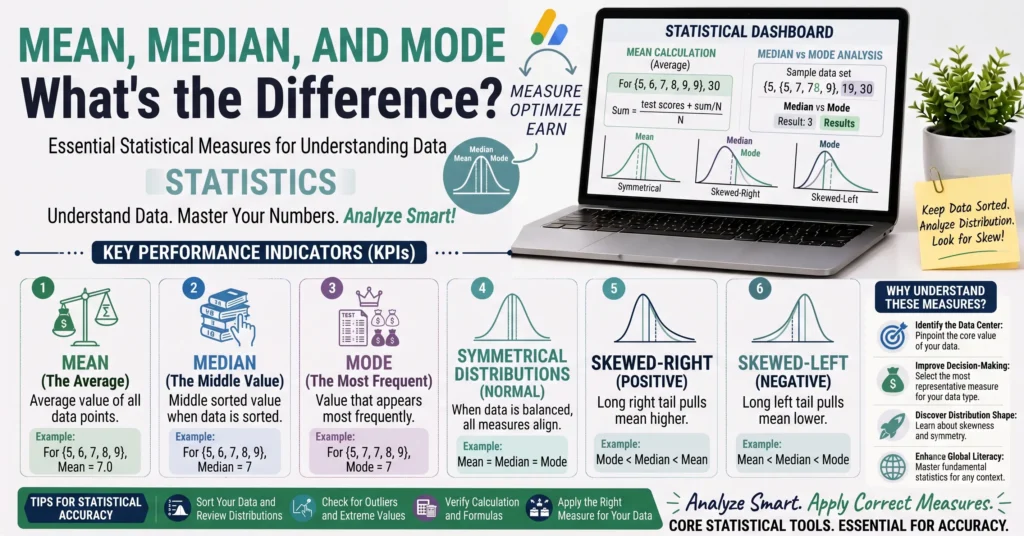
“Average” gets used constantly in everyday language, but it’s actually hiding a genuine ambiguity there isn’t just one kind of average, there are three, and they can produce meaningfully different numbers from the exact same set of data. A news headline reporting “average income” and a teacher announcing the “class average” might both be using the word average, but depending on which specific measure was actually calculated, the number can tell very different stories about what’s typical.
This guide breaks down mean, median, and mode individually, walks through a concrete example showing exactly how dramatically they can diverge on the same dataset, and covers when each one is actually the right measure to reach for.
What Are Measures of Central Tendency?
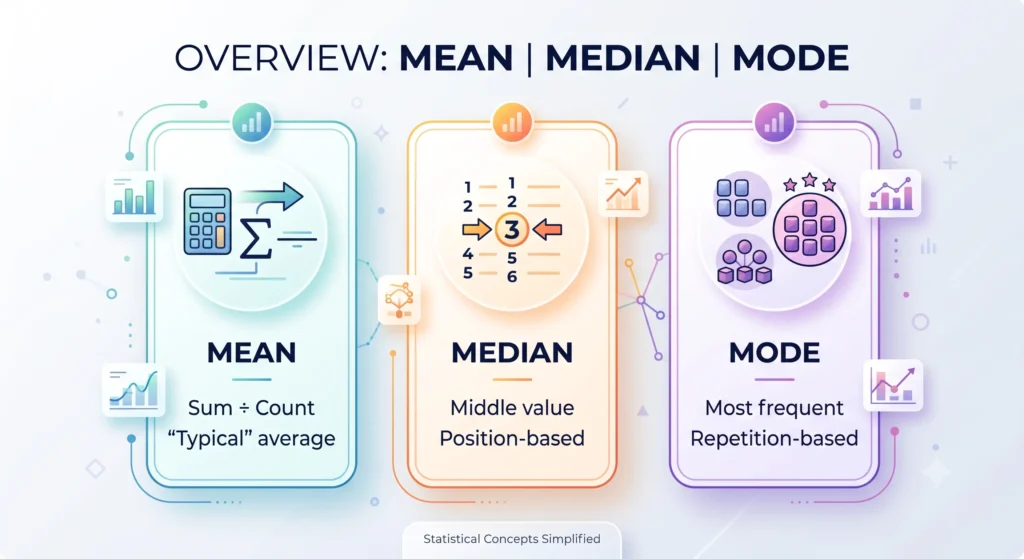
Mean, median, and mode are collectively known as measures of central tendency three different mathematical ways of describing the “center” or “typical value” of a set of numbers. Despite all three technically qualifying as an “average” in the broad sense, they’re calculated completely differently, and understanding when each one is appropriate is genuinely useful statistical literacy that goes well beyond a math classroom.
MeanThe Average Most People Mean
The mean, sometimes called the arithmetic mean, is what most people default to when they say “average” without specifying further. It’s calculated by summing every value in a dataset and dividing by how many values there are.
$$\text{Mean} = \frac{\text{Sum of All Values}}{\text{Number of Values}}$$
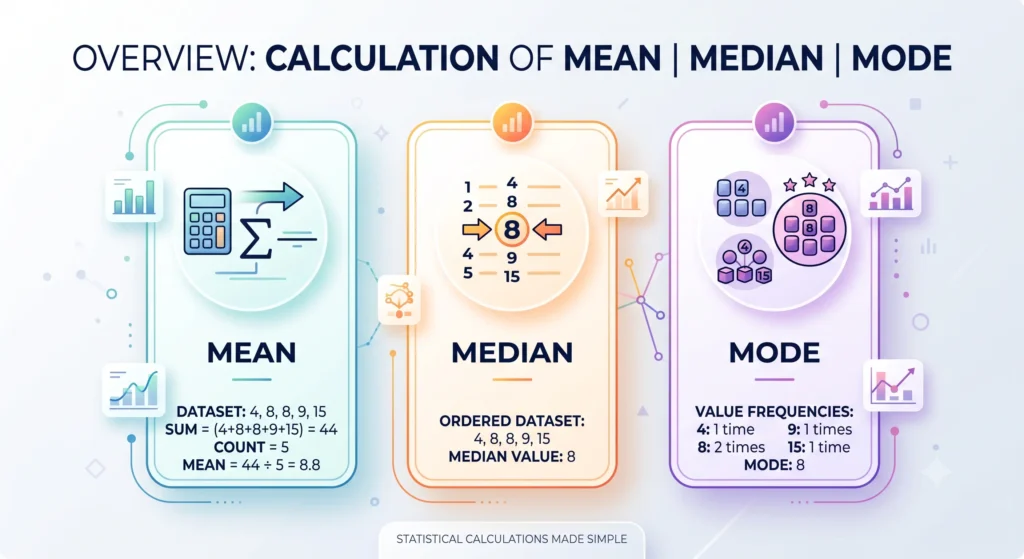
Using a simple dataset 4, 8, 8, 9, 15 the mean is calculated as:
$$\text{Mean} = \frac{4 + 8 + 8 + 9 + 15}{5} = \frac{44}{5} = 8.8$$
Every single value in the dataset contributes to the mean, which is exactly why a single extreme value can pull it noticeably higher or lower than what most of the data actually looks like a point covered in detail further below.
Median The Middle Value
The median is the value that sits exactly in the middle once a dataset is arranged in order from smallest to largest. Unlike the mean, the median doesn’t care about the actual size of every value only about their position once sorted.
For a dataset with an odd number of values, the median is simply the single middle value. Using the same dataset as before 4, 8, 8, 9, 15 the median is 8, the third value once the five numbers are arranged in order.
For a dataset with an even number of values, the median is the average of the two middle values. With the dataset 4, 8, 8, 9, the two middle values are 8 and 8, so the median is:
$$\frac{8 + 8}{2} = 8$$
Mode The Most Frequent Value
The mode is simply the value that appears most often in a dataset. Unlike mean and median, a dataset can have no mode at all if every value is unique, exactly one mode if a single value repeats more than any other, or multiple modes if two or more values are tied for the most frequent.
In the dataset 4, 8, 8, 9, 15, the mode is 8, since it appears twice while every other value appears only once. A dataset like 2, 4, 4, 6, 6, 9 would be bimodal, with two modes 4 and 6 since both appear exactly twice.
Why the Three Can Tell Completely Different Stories
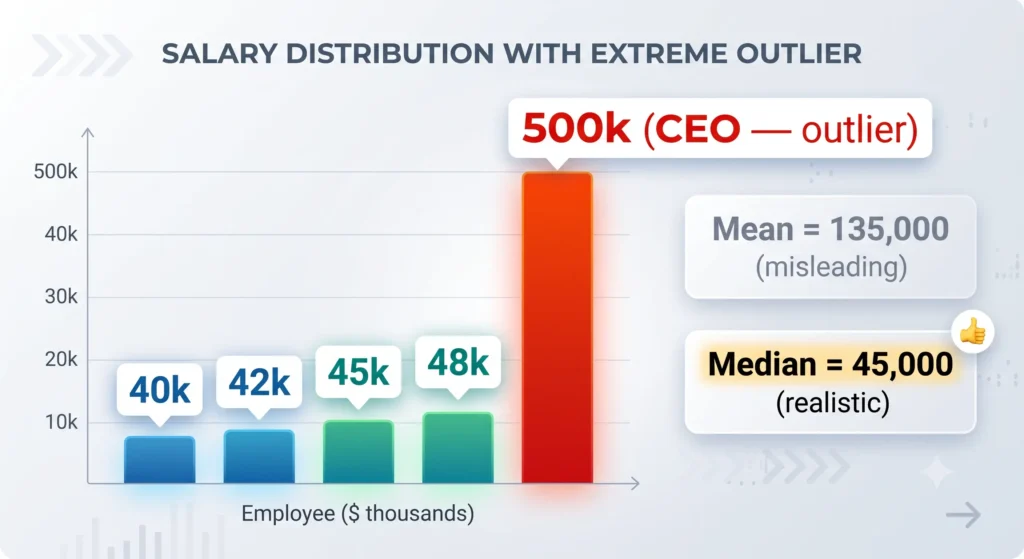
Here’s where the distinction genuinely matters in practice, rather than just as a math exercise. Consider a small company’s salaries: four employees earning PKR 40,000, 42,000, 45,000, and 48,000, alongside one senior executive earning PKR 500,000.
The mean salary here is:
$$\frac{40,000 + 42,000 + 45,000 + 48,000 + 500,000}{5} = \frac{675,000}{5} = \text{PKR } 135,000$$
The median salary, on the other hand, is PKR 45,000 the middle value once the five salaries are sorted.
These two numbers paint dramatically different pictures of the same company. The mean suggests a “typical” employee earns PKR 135,000, which is genuinely misleading it’s being pulled far upward by a single outlier salary. The median, at PKR 45,000, much more accurately reflects what most employees at this company actually earn. This is exactly why income and salary statistics in economics and journalism are often reported as medians rather than means a small number of extremely high earners can distort a mean into a figure that doesn’t represent anyone’s actual reality.
When to Use Which Measure
The mean works best when a dataset doesn’t contain extreme outliers, and when you specifically want every value’s magnitude to matter GPA calculation is a good example, where every grade point genuinely should count toward the final average, not just its relative position. The median is the better choice whenever a dataset might contain outliers that could distort a simple average, such as income, home prices, or any set of values where a few extreme entries shouldn’t dominate the overall picture. The mode is most useful for categorical or discrete data where you want to know the single most common occurrence the most frequently purchased size, the most common score on a test, or the most repeated response in a survey situations where “most common” matters more than a calculated average.
How This Connects to Grades and GPA
When an instructor announces a “class average” after an exam, that figure is almost always the mean of every student’s score, which is exactly why one exceptionally high or unusually low score can shift the reported average more than most students in the class would intuitively expect. This is actually part of the reasoning behind curved grading, covered in our Grade Calculator guide if a class mean turns out lower than expected because a handful of students struggled significantly, a curve can help realign grades with what most of the class actually demonstrated, rather than letting a small number of low scores drag the whole distribution down.
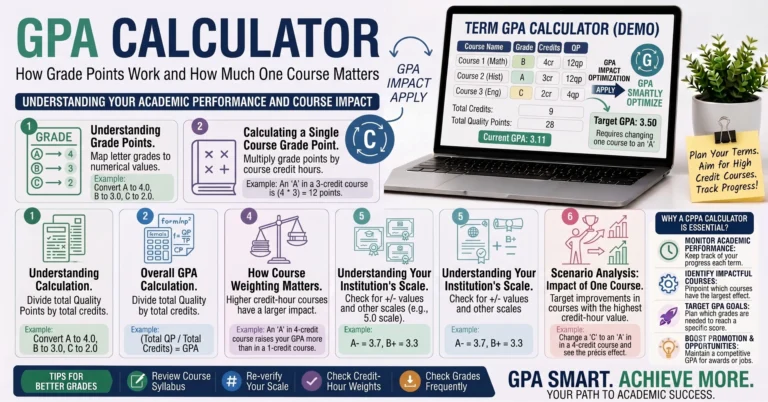
GPA itself is fundamentally a mean calculation as well specifically a weighted mean, where each course’s grade point is weighted by its credit hours before being averaged together, as covered in detail in our GPA Calculator guide. Understanding that GPA is a mean, not a median, explains why a single very poor grade in a heavily-weighted course can pull your GPA down more noticeably than the same poor grade in a lightly-weighted one would.
How to Use Our Percentage Calculator for Related Math
While InnovaiTools doesn’t currently offer a dedicated mean, median, and mode calculator, the underlying concepts connect directly to tools we do offer. Our Percentage Calculator handles the everyday percentage math that often accompanies these kinds of statistical questions, and our GPA Calculator applies the weighted mean concept covered in this guide directly to academic grade calculations.
Common Mistakes When Interpreting “Average”
- Mistake 1: Assuming “average” always refers to the mean, when the median is often the more representative figure for skewed data containing outliers.
- Mistake 2: Reporting or interpreting mean income, salary, or price data without checking whether a small number of extreme values might be distorting the figure.
- Mistake 3: Assuming every dataset has exactly one mode, when some datasets have no repeated value at all, and others are genuinely bimodal or multimodal.
- Mistake 4: Confusing “typical” with “mean” in everyday interpretation, when the median frequently represents a more realistic “typical” value in distributions with significant outliers.
Key Terms Related to Central Tendency
- Mean: The sum of all values in a dataset divided by the number of values, commonly referred to as the arithmetic average.
- Median: The middle value in a dataset once arranged in order, or the average of the two middle values if the dataset has an even number of entries.
- Mode: The value that appears most frequently in a dataset, which may not exist, or may occur more than once if multiple values are tied.
- Outlier: An unusually high or low value relative to the rest of a dataset, capable of significantly distorting the mean without affecting the median nearly as much.
- Skewed Distribution: A dataset where values are not evenly distributed around the center, often caused by one or more outliers pulling the mean away from where most of the data actually sits.
Frequently Asked Questions About Mean, Median, and Mode
Q1: What is the difference between mean, median, and mode?
The mean is the sum of all values divided by the count. The median is the middle value once sorted. The mode is the most frequently occurring value. All three describe “central tendency” but are calculated completely differently.
Q2: How do you calculate the median with an even number of values?
Average the two middle values once the dataset is sorted in order add them together and divide by two.
Q3: Can a dataset have more than one mode?
Yes, a dataset is called bimodal if two values are tied for most frequent, or multimodal if more than two values share that distinction.
Q4: Why do income statistics usually report median instead of mean?
Because a relatively small number of very high earners can pull the mean upward significantly, making it a poor representation of what a typical person actually earns. The median is far less affected by these outliers.
Q5: Is GPA a mean, median, or mode?
GPA is a weighted mean each course’s grade point is weighted by its credit hours and then averaged together, rather than using the middle value or most frequent grade.
Q6: What is an outlier and how does it affect the mean?
An outlier is an unusually high or low value compared to the rest of a dataset. Because the mean factors in the magnitude of every value, even a single extreme outlier can shift it noticeably, while the median remains largely unaffected.
Q7: Which measure should I use for skewed data?
The median is generally the better choice for skewed data, since it isn’t distorted by extreme outliers the way the mean can be.
Q8: Can a dataset have no mode?
Yes, if every value in a dataset is unique with no repeats, there is no mode at all.
Q9: Does class average use mean or median?
A reported “class average” is almost always the mean of all student scores, which is why one unusually high or low score can shift it more than most students would expect.
Q10: Is there a free tool to calculate mean, median, and mode?
InnovaiTools doesn’t currently offer a dedicated calculator for this specific purpose, though our Percentage Calculator and GPA Calculator cover closely related percentage and weighted-average calculations.
Final Thoughts
The word “average” hides a genuine choice between three fundamentally different calculations, and that choice matters far more than it might seem at first glance the same dataset can produce a mean, median, and mode that tell noticeably different stories, especially once outliers enter the picture. Whether you’re interpreting a reported class average, reading an income statistic, or thinking through your own GPA, knowing which specific measure is actually being used and why turns a single ambiguous number into something you can genuinely evaluate.
For the weighted-average math this guide connects directly to, our GPA Calculator and Percentage Calculator at InnovaiTools are free to use any time you need them.

Arid is a web developer and computer expert who specializes in building practical utility web applications. With a strong focus on technical problem-solving and user experience, he develops efficient online calculators and writing tools designed to help students, bloggers, and professionals streamline their daily tasks.